When you’re building applications in Python, it can be really helpful to see live information about backend calls, errors, traces and monitor data.
OpenTelemetry, an open-source project from the Cloud Native Computing Foundation (CNCF) is designed to cater for all of those things along with a catalog of extensions to instrument common libraries and frameworks in Python like Flask, Django, Requests and FastAPI.
In this tutorial, I’ll show you how to setup OpenTelemetry in a little Flask project and configure instrumentation with the Aspire dashboard.
You’ll need Docker installed for this tutorial and some code to instrument. If you’re already familiar with OpenTelemetry, skip to the section on configuring OTLP.
Installing OpenTelemetry
To get started with OpenTelemetry, I recommend installing the opentelemetry-distro package from PyPi which comes bundled with a common set of libraries and instrumentation. I recommend having a look at the Instrumentation Registry for more packages and instrumentation options.`
The second package you’ll need is opentelemetry-exporter-otlp-proto-grpc which exports all OpenTelemetry data over gRPC to a designated endpoint. This can be any service that supports OTLP-over-gRPC like Jaegar, New Relic, ServiceNow Lightstep or Aspire. Some OTLP services are paid subscriptions, others are self-hosted and open-source. I’m going to focus on getting this working with Aspire since it’s free, open-source and can run locally.
Add the following requirements to your requirements.txt or pip-install them to get started:
opentelemetry-distro
opentelemetry-exporter-otlp-proto-grpc
Configuring OTLP for any OpenTelemetry Instrumentation
OpenTelemetry has 3 high-level components: Tracing, Metrics and Logging. Logging isn’t fully supported in Python yet for OpenTelemetry, but I’m going to include a way of using the experimental API anyway, so you can see what’s possible and remove what you don’t need.
For any OpenTelemetry instrumentation, you’ll need to configure the OTLP exporter to send data to a backend. This is done by creating a TracerProvider, MeterProvider, LoggerProvider and configuring the exporter.
Here’s a sample of configuring all of those things. It’s a lot of boilerplate, so I recommend putting it in a separate file. I’ll call this otel_grpc.py :
import logging

from opentelemetry.sdk.resources import SERVICE_NAME, Resource

from opentelemetry import trace
from opentelemetry.exporter.otlp.proto.grpc.trace_exporter import OTLPSpanExporter
from opentelemetry.sdk.trace import TracerProvider
from opentelemetry.sdk.trace.export import BatchSpanProcessor

from opentelemetry import metrics
from opentelemetry.exporter.otlp.proto.grpc.metric_exporter import OTLPMetricExporter
from opentelemetry.sdk.metrics import MeterProvider
from opentelemetry.sdk.metrics.export import PeriodicExportingMetricReader

# Logging (Experimental)
from opentelemetry._logs import set_logger_provider
from opentelemetry.exporter.otlp.proto.grpc._log_exporter import (
    OTLPLogExporter,
)
from opentelemetry.sdk._logs import LoggerProvider, LoggingHandler
from opentelemetry.sdk._logs.export import BatchLogRecordProcessor
from opentelemetry.sdk.resources import Resource


def configure_otel_otlp(service_name: str = "azure-search-openai-demo", endpoint: str = "http://localhost:4317", insecure=True):
    # Service name is required for most backends
    resource = Resource(attributes={
        SERVICE_NAME: service_name
    })

    # Configure Tracing
    traceProvider = TracerProvider(resource=resource)
    processor = BatchSpanProcessor(OTLPSpanExporter(endpoint=endpoint, insecure=insecure))
    traceProvider.add_span_processor(processor)
    trace.set_tracer_provider(traceProvider)

    # Configure Metrics
    reader = PeriodicExportingMetricReader(
        OTLPMetricExporter(endpoint=endpoint, insecure=insecure)
    )
    meterProvider = MeterProvider(resource=resource, metric_readers=[reader])
    metrics.set_meter_provider(meterProvider)

    # Configure Logging
    logger_provider = LoggerProvider(
        resource=resource
    )
    set_logger_provider(logger_provider)

    exporter = OTLPLogExporter(insecure=insecure)
    logger_provider.add_log_record_processor(BatchLogRecordProcessor(exporter))
    handler = LoggingHandler(level=logging.NOTSET, logger_provider=logger_provider)

    # Attach OTLP handler to root logger
    logging.getLogger().addHandler(handler)
Next, from your application’s entry point, you can call this function to configure the OTLP exporter. Do this before running the .instrument() calls from various instrumentation libraries:
from otel_grpc import configure_otel_otlp

configure_otel_otlp("my-service-name", endpoint=os.getenv("OTLP_GRPC_ENDPOINT"))

# Instrumentation code here
For Flask, the instrumentation would look like:
from flask import Flask
from opentelemetry.instrumentation.flask import FlaskInstrumentor

app = Flask(__name__)

FlaskInstrumentor().instrument_app(app)
Running the Aspire Dashboard
.NET Aspire is “an opinionated, cloud ready stack for building observable, production ready, distributed applications.”
Lovely, but what does that have to do with Python? Well, one of the components of .NET Aspire is a simple, OTLP-compatible service that runs in a Docker container and has a web UI for local development and testing. It doesn’t require any authentication or setup, so it’s a great way to get started with OpenTelemetry. Since it runs in Docker, it’s easy to start and stop which is ideal for local development, and you don’t need to have .NET installed to use it, just Docker.
To get started, pull and run this Docker image:
docker run --rm -it -p 18888:18888 -p 4317:18889 -d --name aspire-dashboard -e DOTNET_DASHBOARD_UNSECURED_ALLOW_ANONYMOUS='true' mcr.microsoft.com/dotnet/nightly/aspire-dashboard:8.0-preview
This will also port-forward the gRPC endpoint to localhost:4317 which is what we’ll use in the OTLP exporter configuration and the UI will be available at http://localhost:18888.
After that you can run your Python application and see the traces and metrics in the Aspire dashboard.
This example sets DOTNET_DASHBOARD_UNSECURED_ALLOW_ANONYMOUS to true which allows the dashboard to run without any authentication. This is fine for local development, but you must secure the dashboard if you’re running it in a production environment.
Navigating the Aspire Dashboard
In your browser, go to http://localhost:18888, and you’ll see the Aspire dashboard. You can navigate to the Traces, Metrics and Logs tabs to see the data from your Python application. A bare Flask app wouldn’t be very interesting, so I’ve added tracing to a big sample project we have at azure-search-openai-demo which uses a ton of backend services and a lot of customization in Flask.
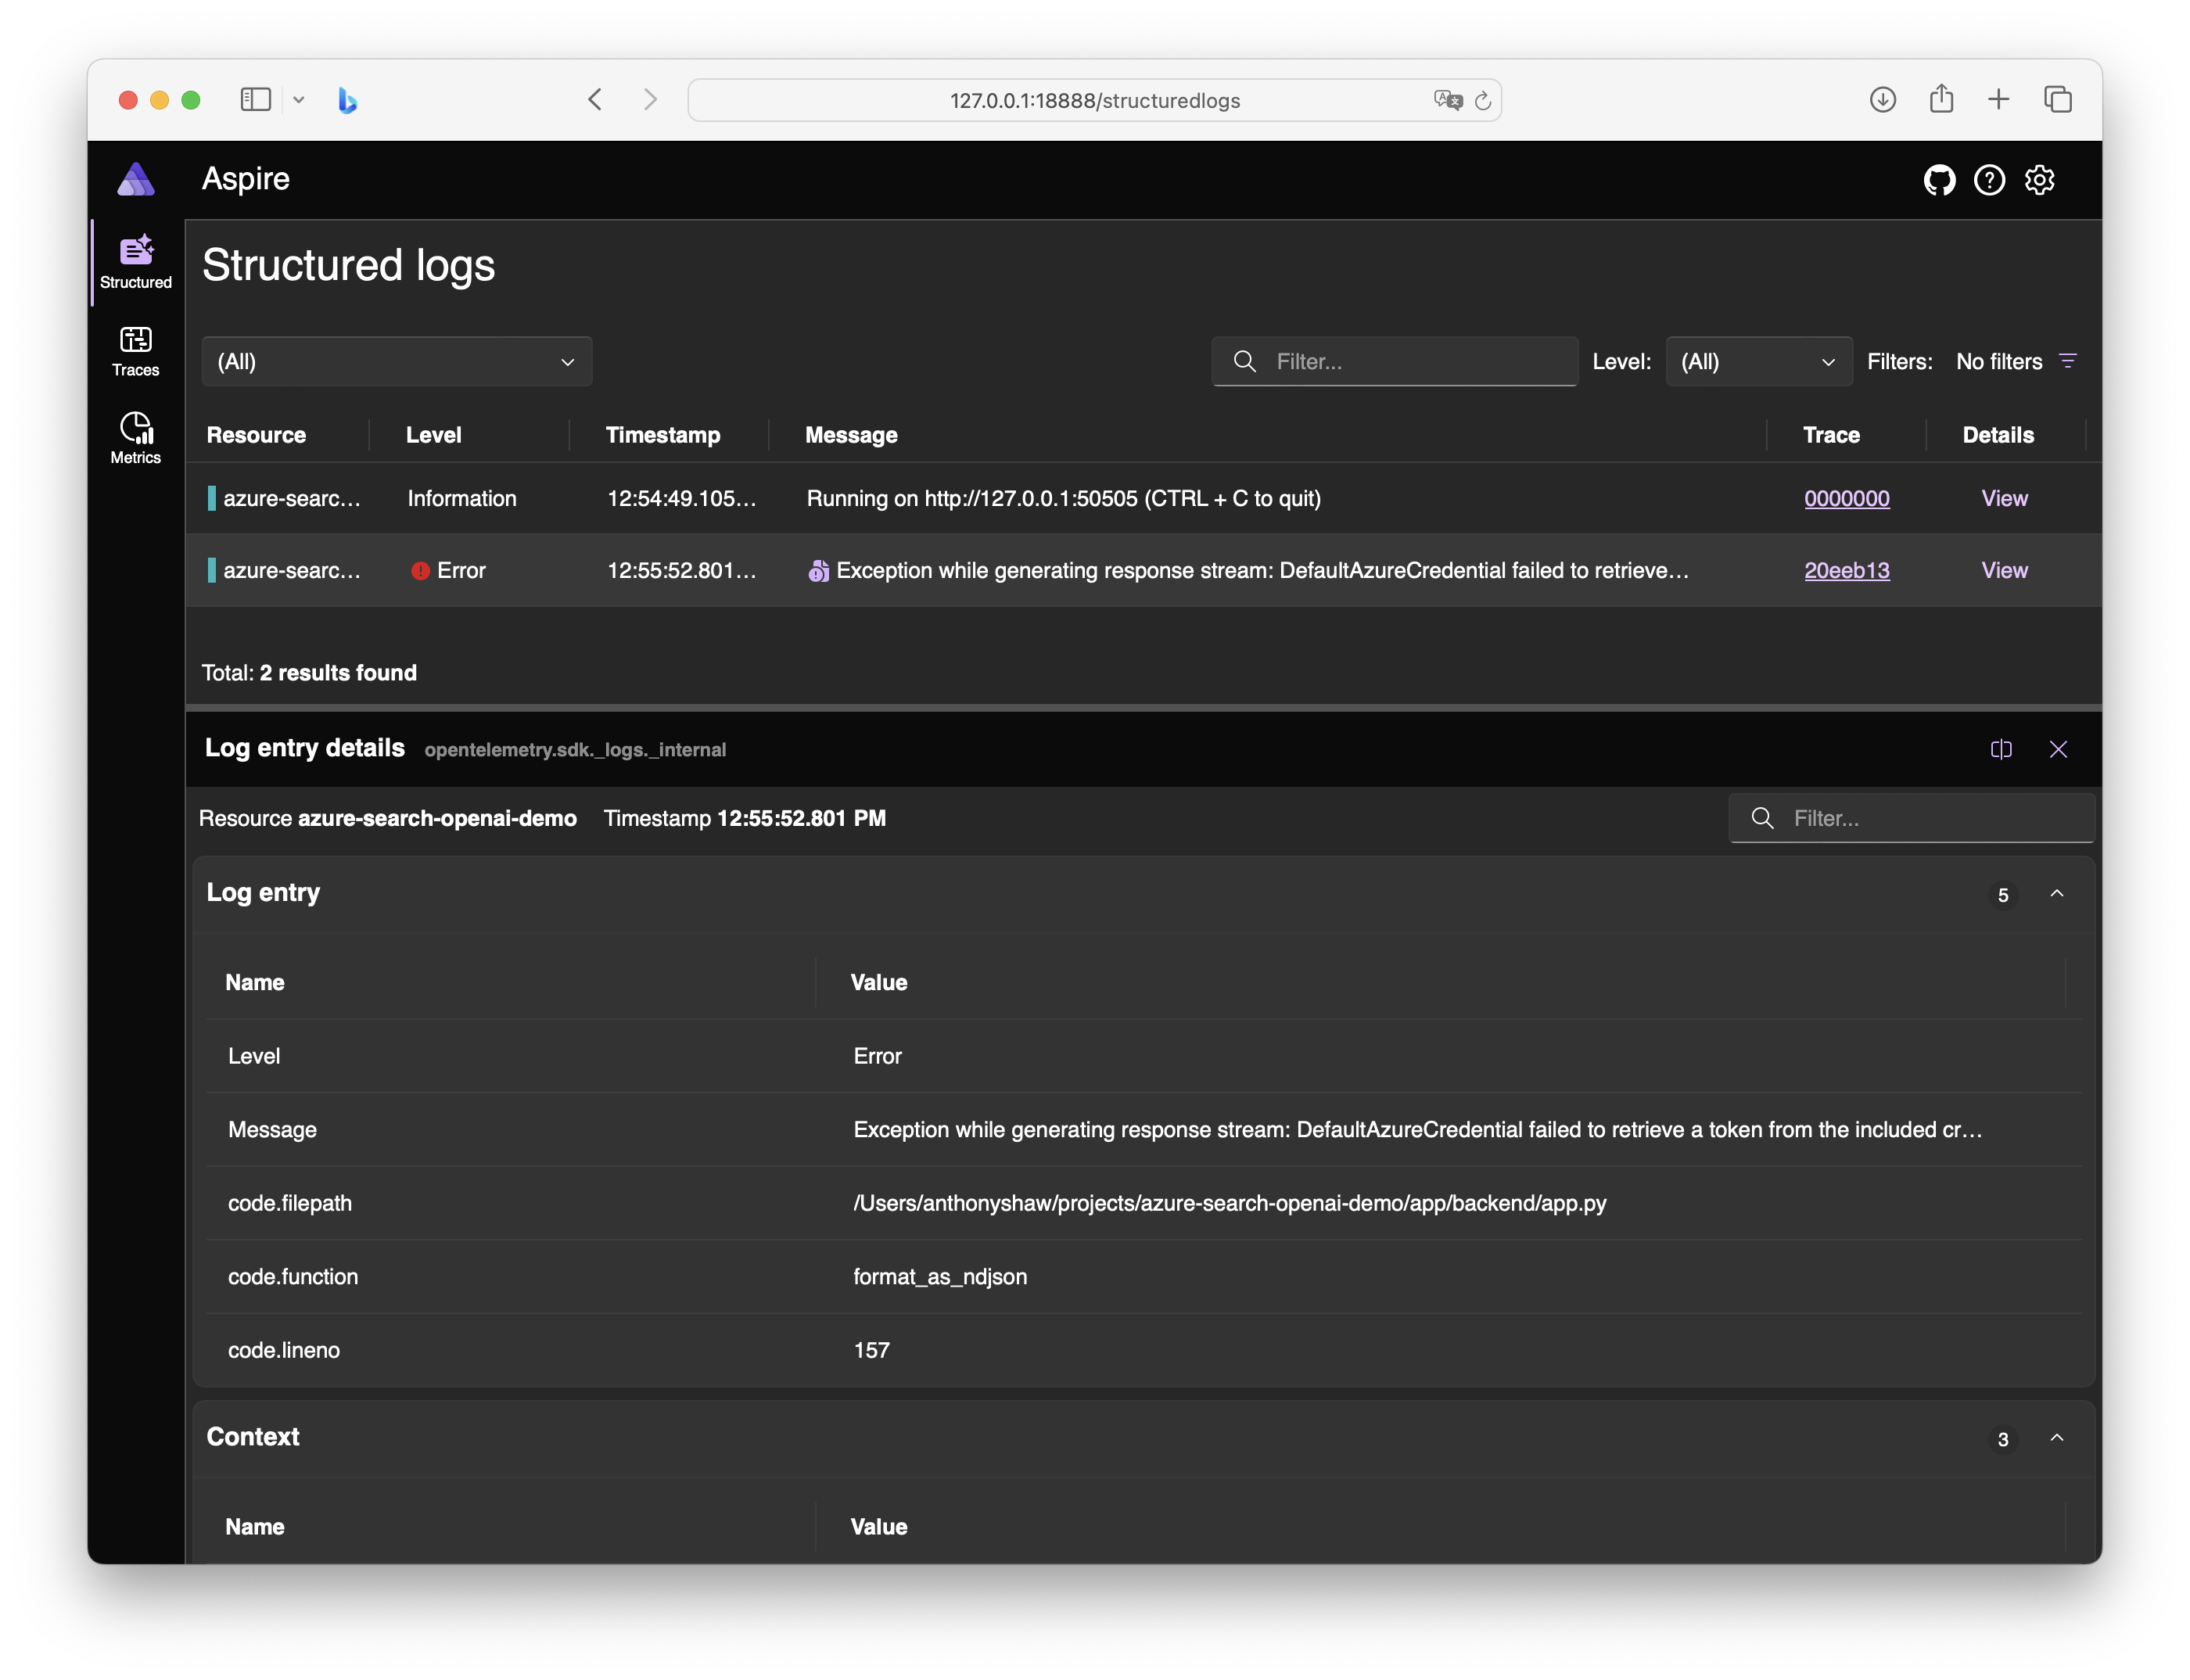
The first tab to explore is Logs. This will capture any logs that are sent to the OpenTelemetry logger. Python logging is complicated. In the code above, I setup logging at the root logger. For something like Django, you’ll want to configure that handler to capture logs from the Django logger. In the sample project, I’ve added a few logs to the Flask app to show how they appear in the dashboard:
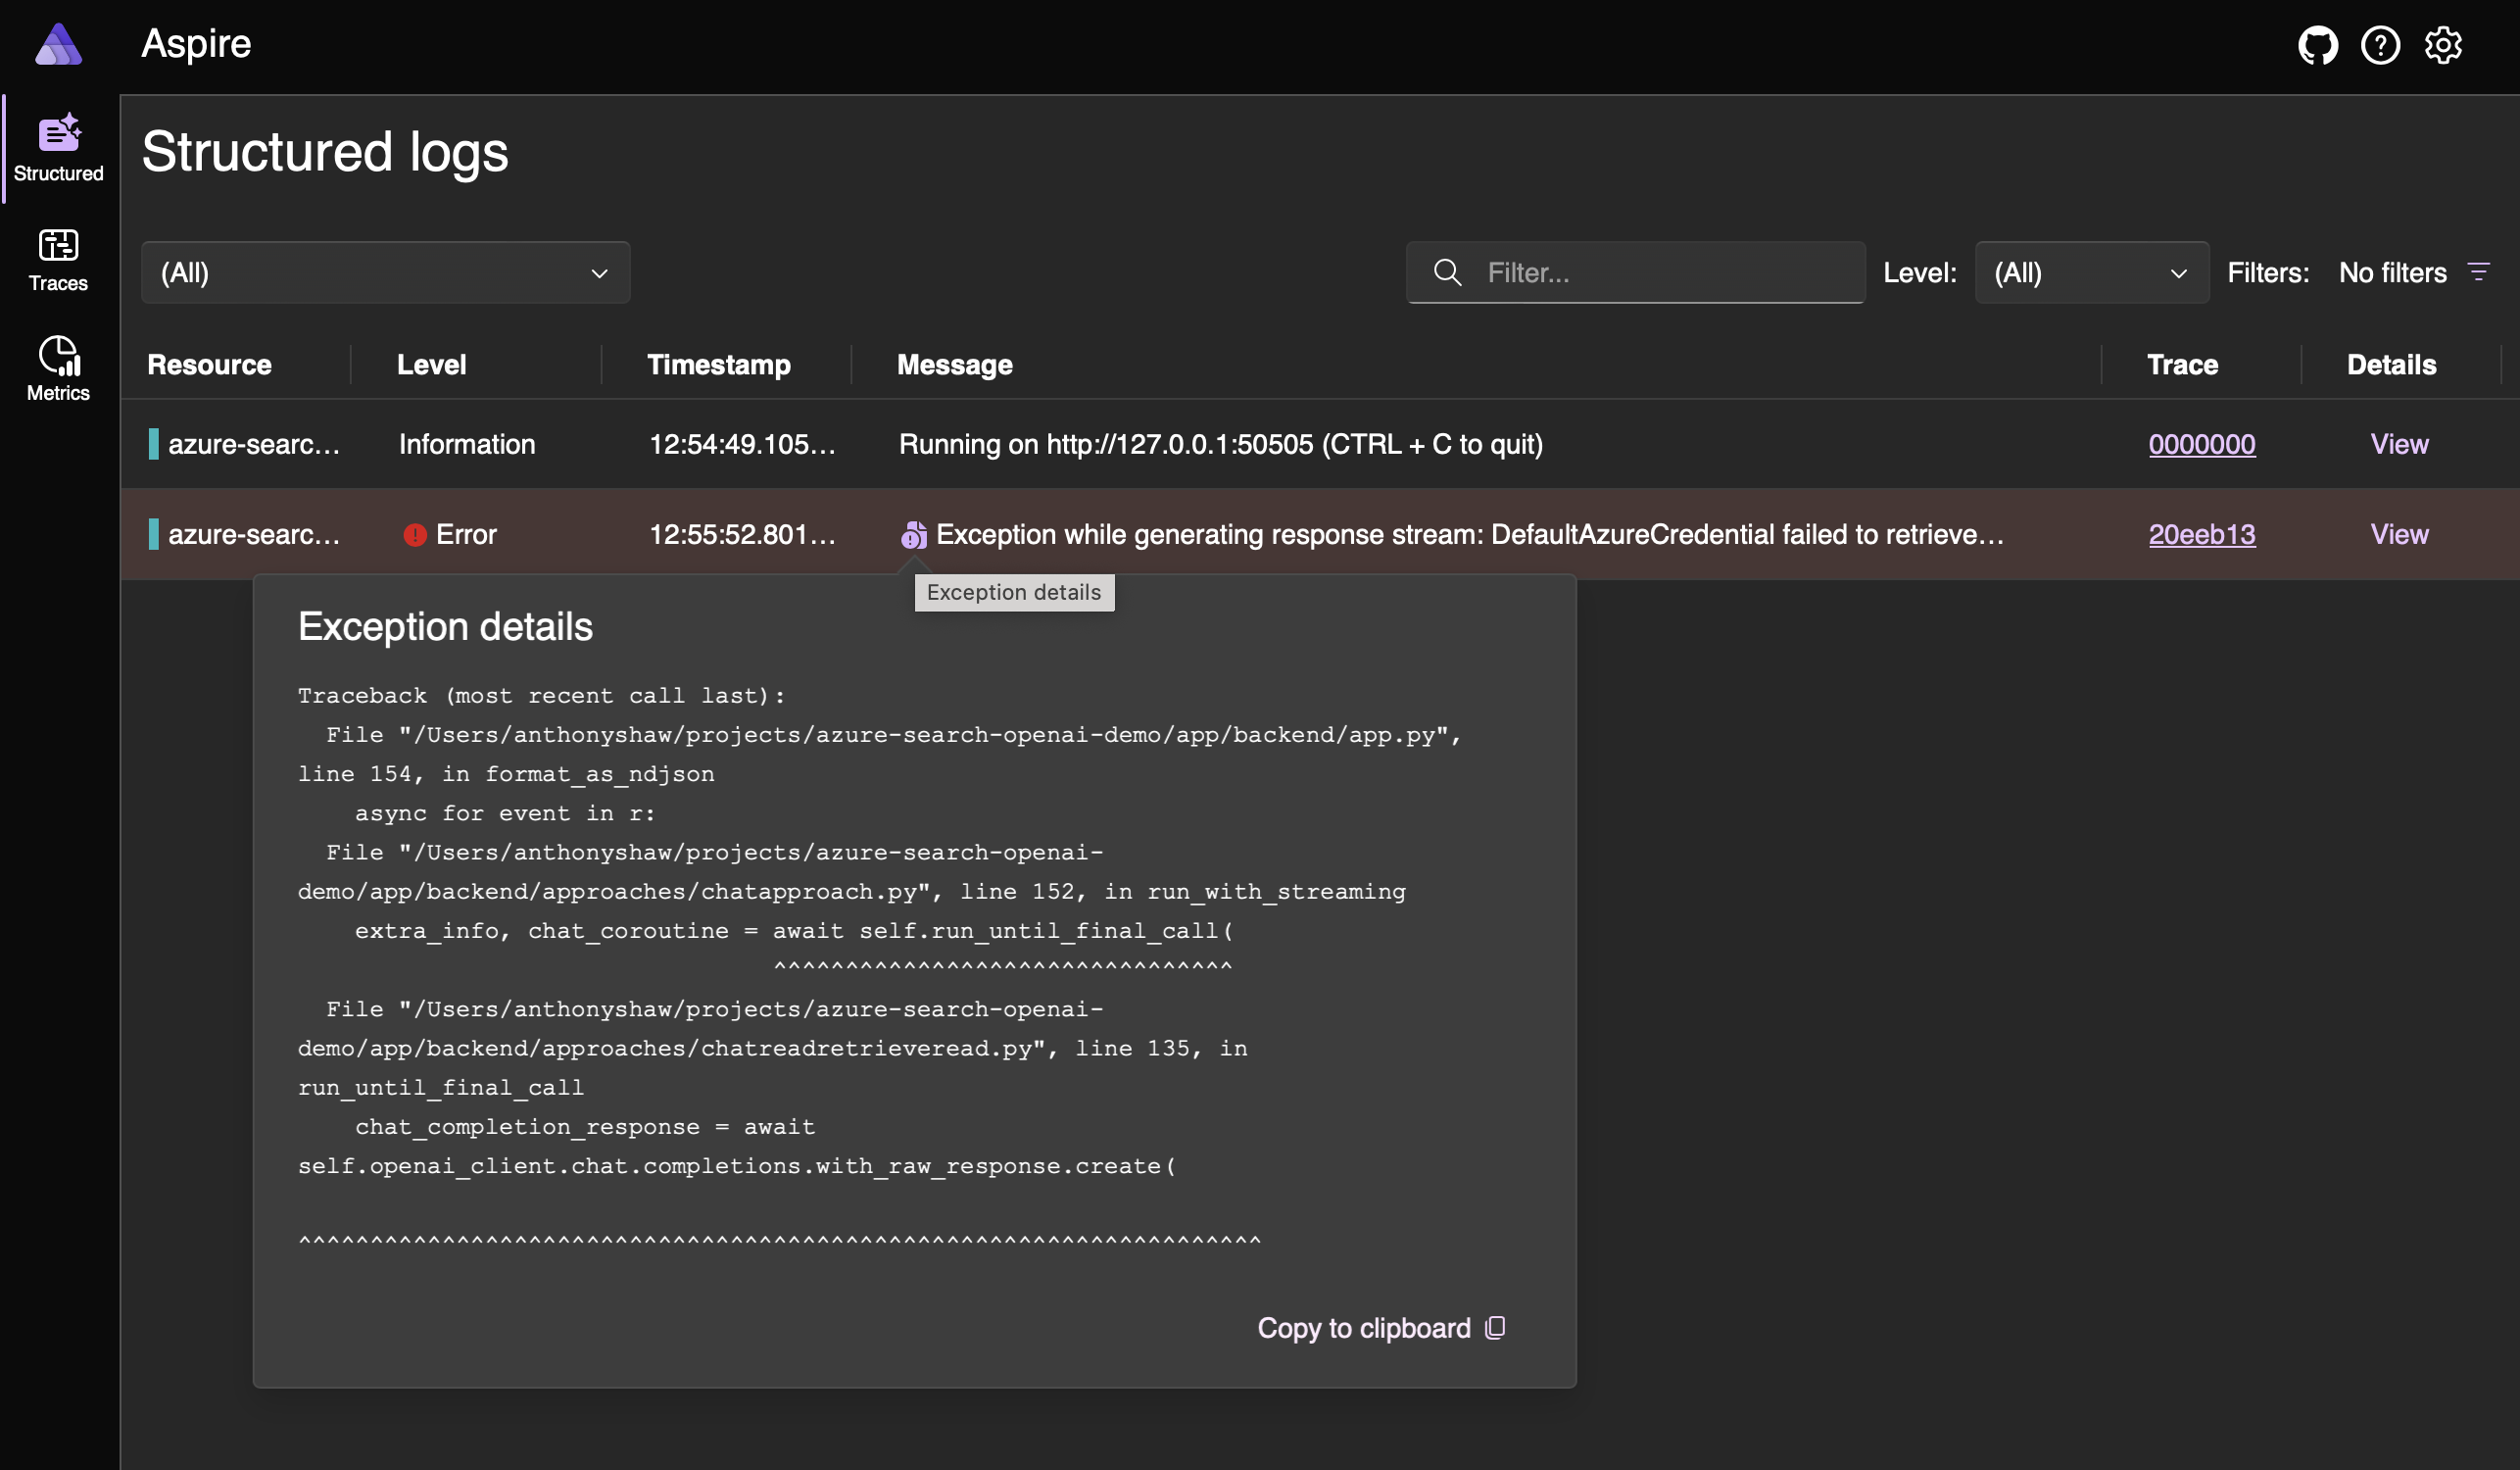
If your code raised an exception, the traceback is available in the UI. This is, in my opinion far easier to read than a stack trace in the terminal along with all the other information written to stdout from Gunicorn:
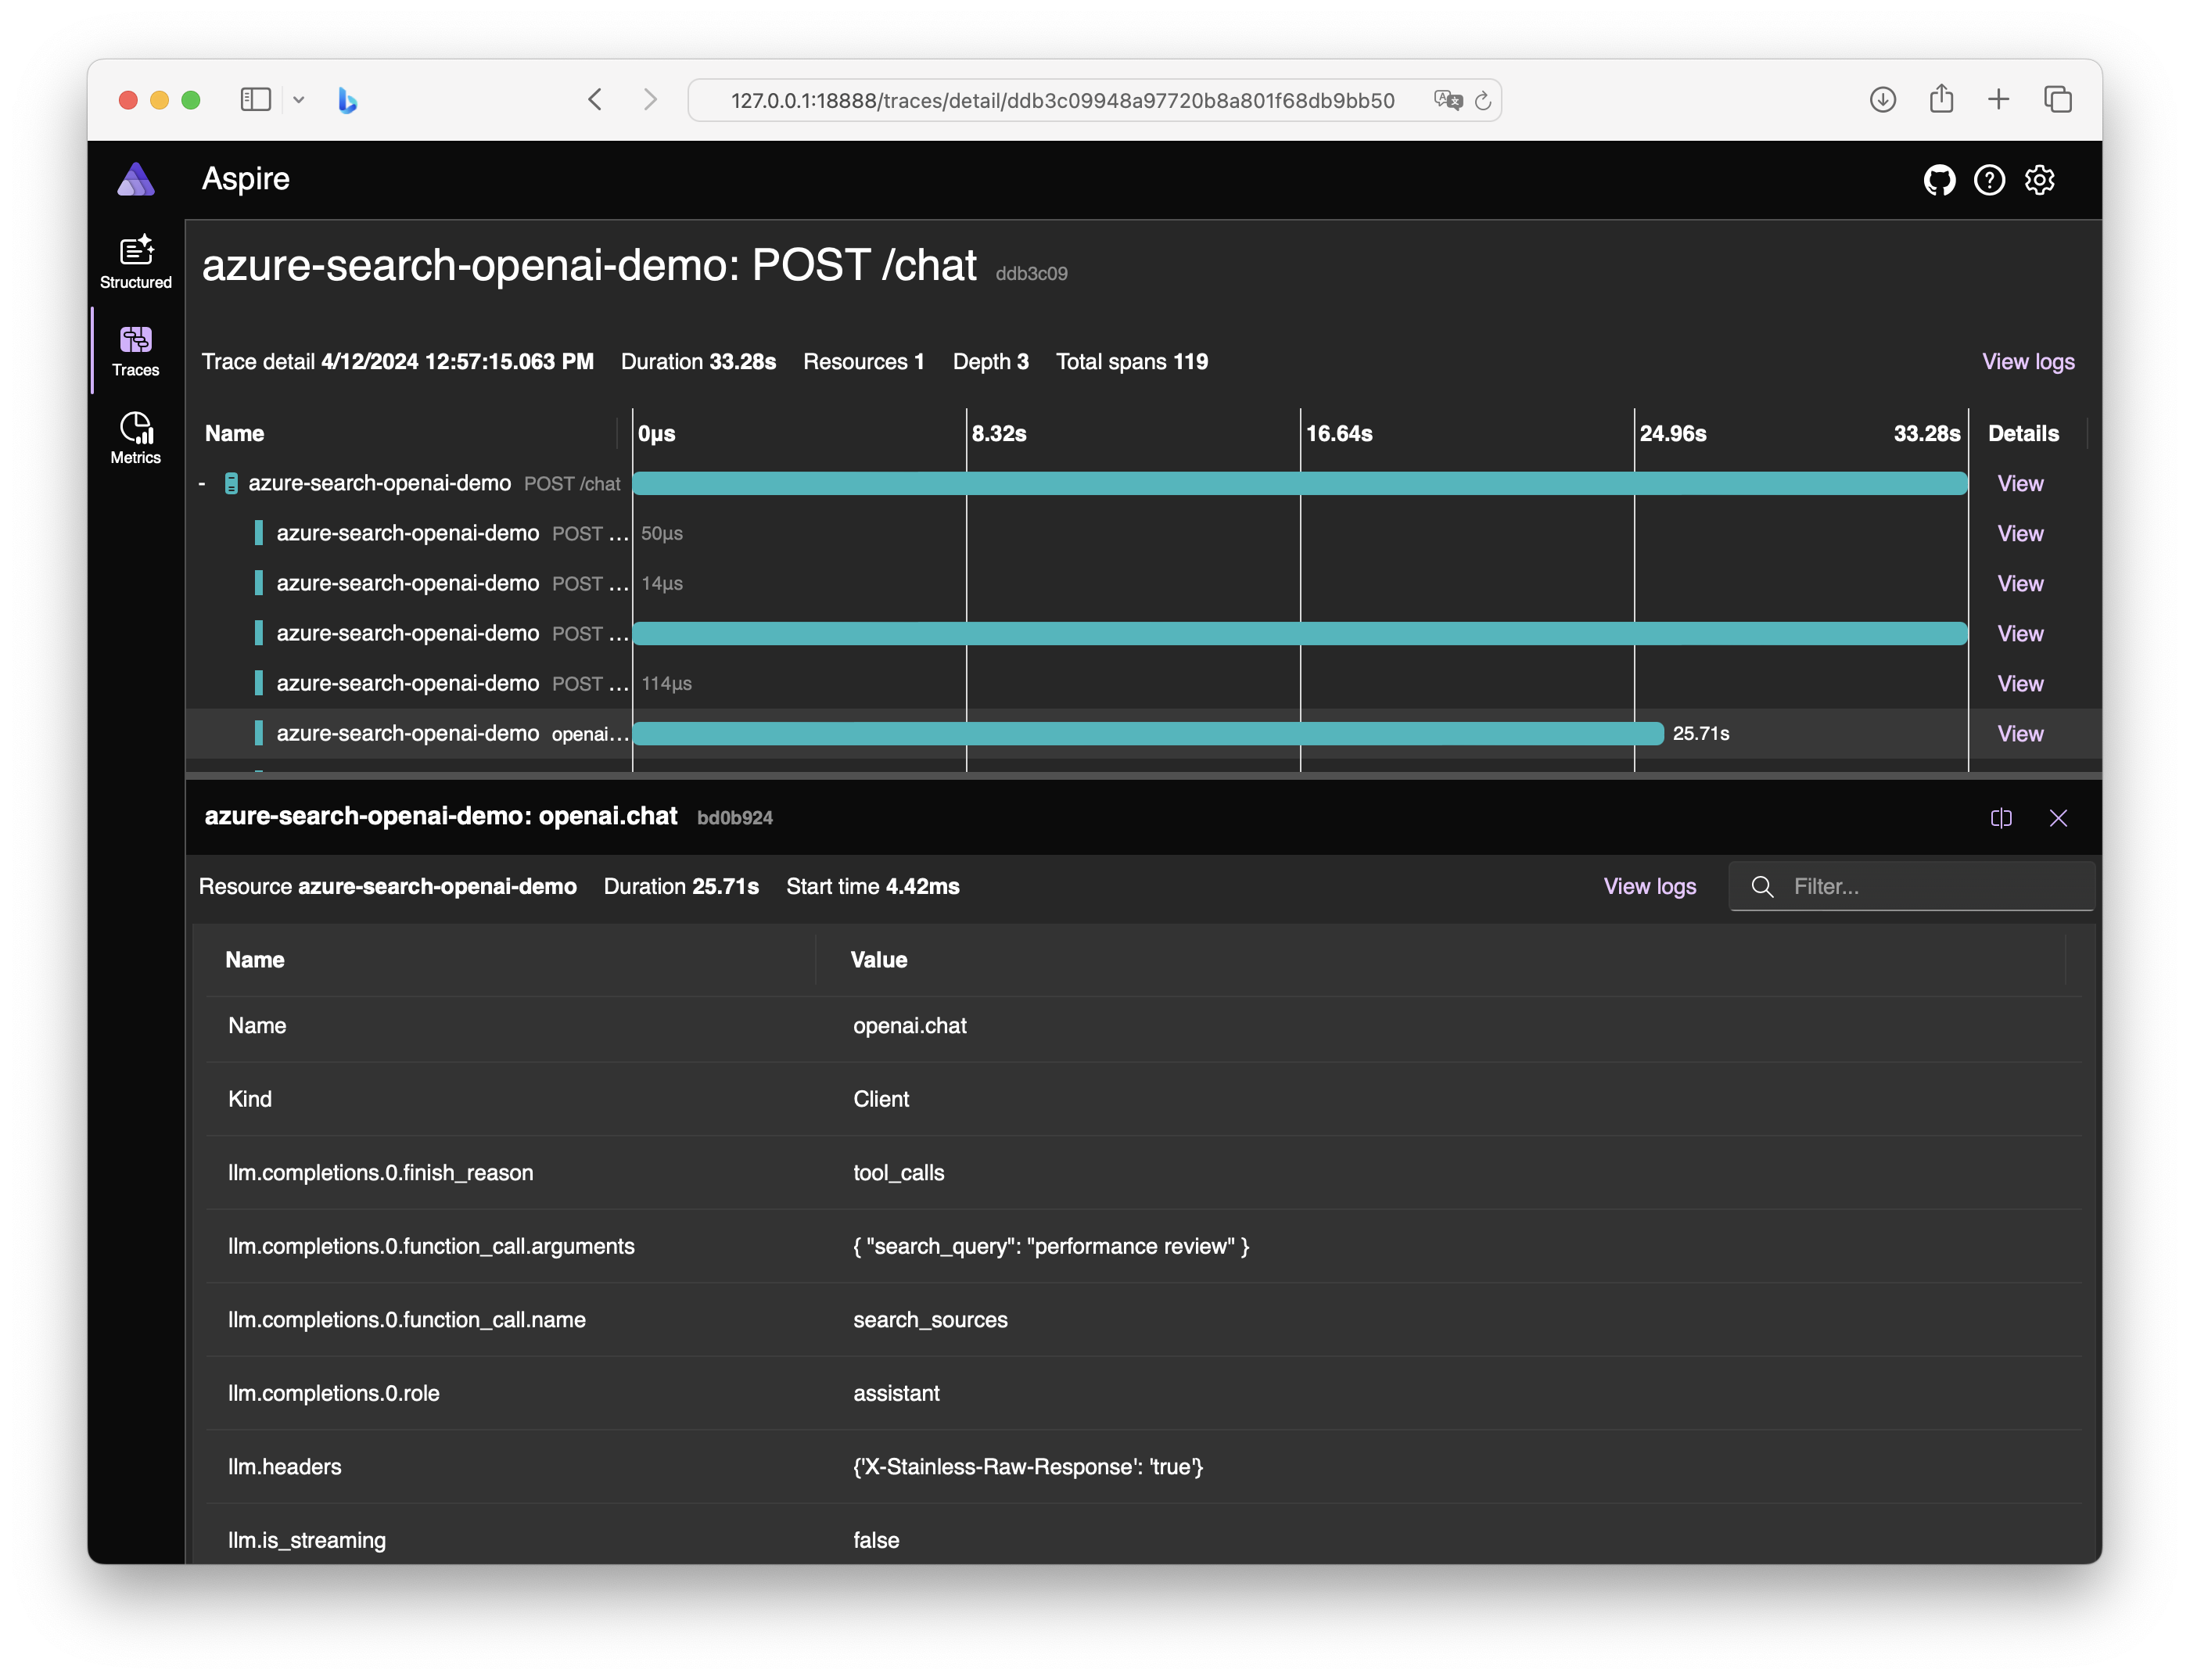
The second tab is Traces. This will show you the traces of requests that are made to the Flask app. You can see the duration of the request, the status code and the path that was requested. You can also see the breakdown of the request in the waterfall view. In OpenTelemetry, traces have a parent-child relationship, so you can see the order of operations in the request. For example, if a call to POST /chat in Flask calls some other APIs in the backend, you’ll see those calls in the trace. You’ll also see any exceptions and where they happened in the trace. This is really helpful for debugging and performance tuning.
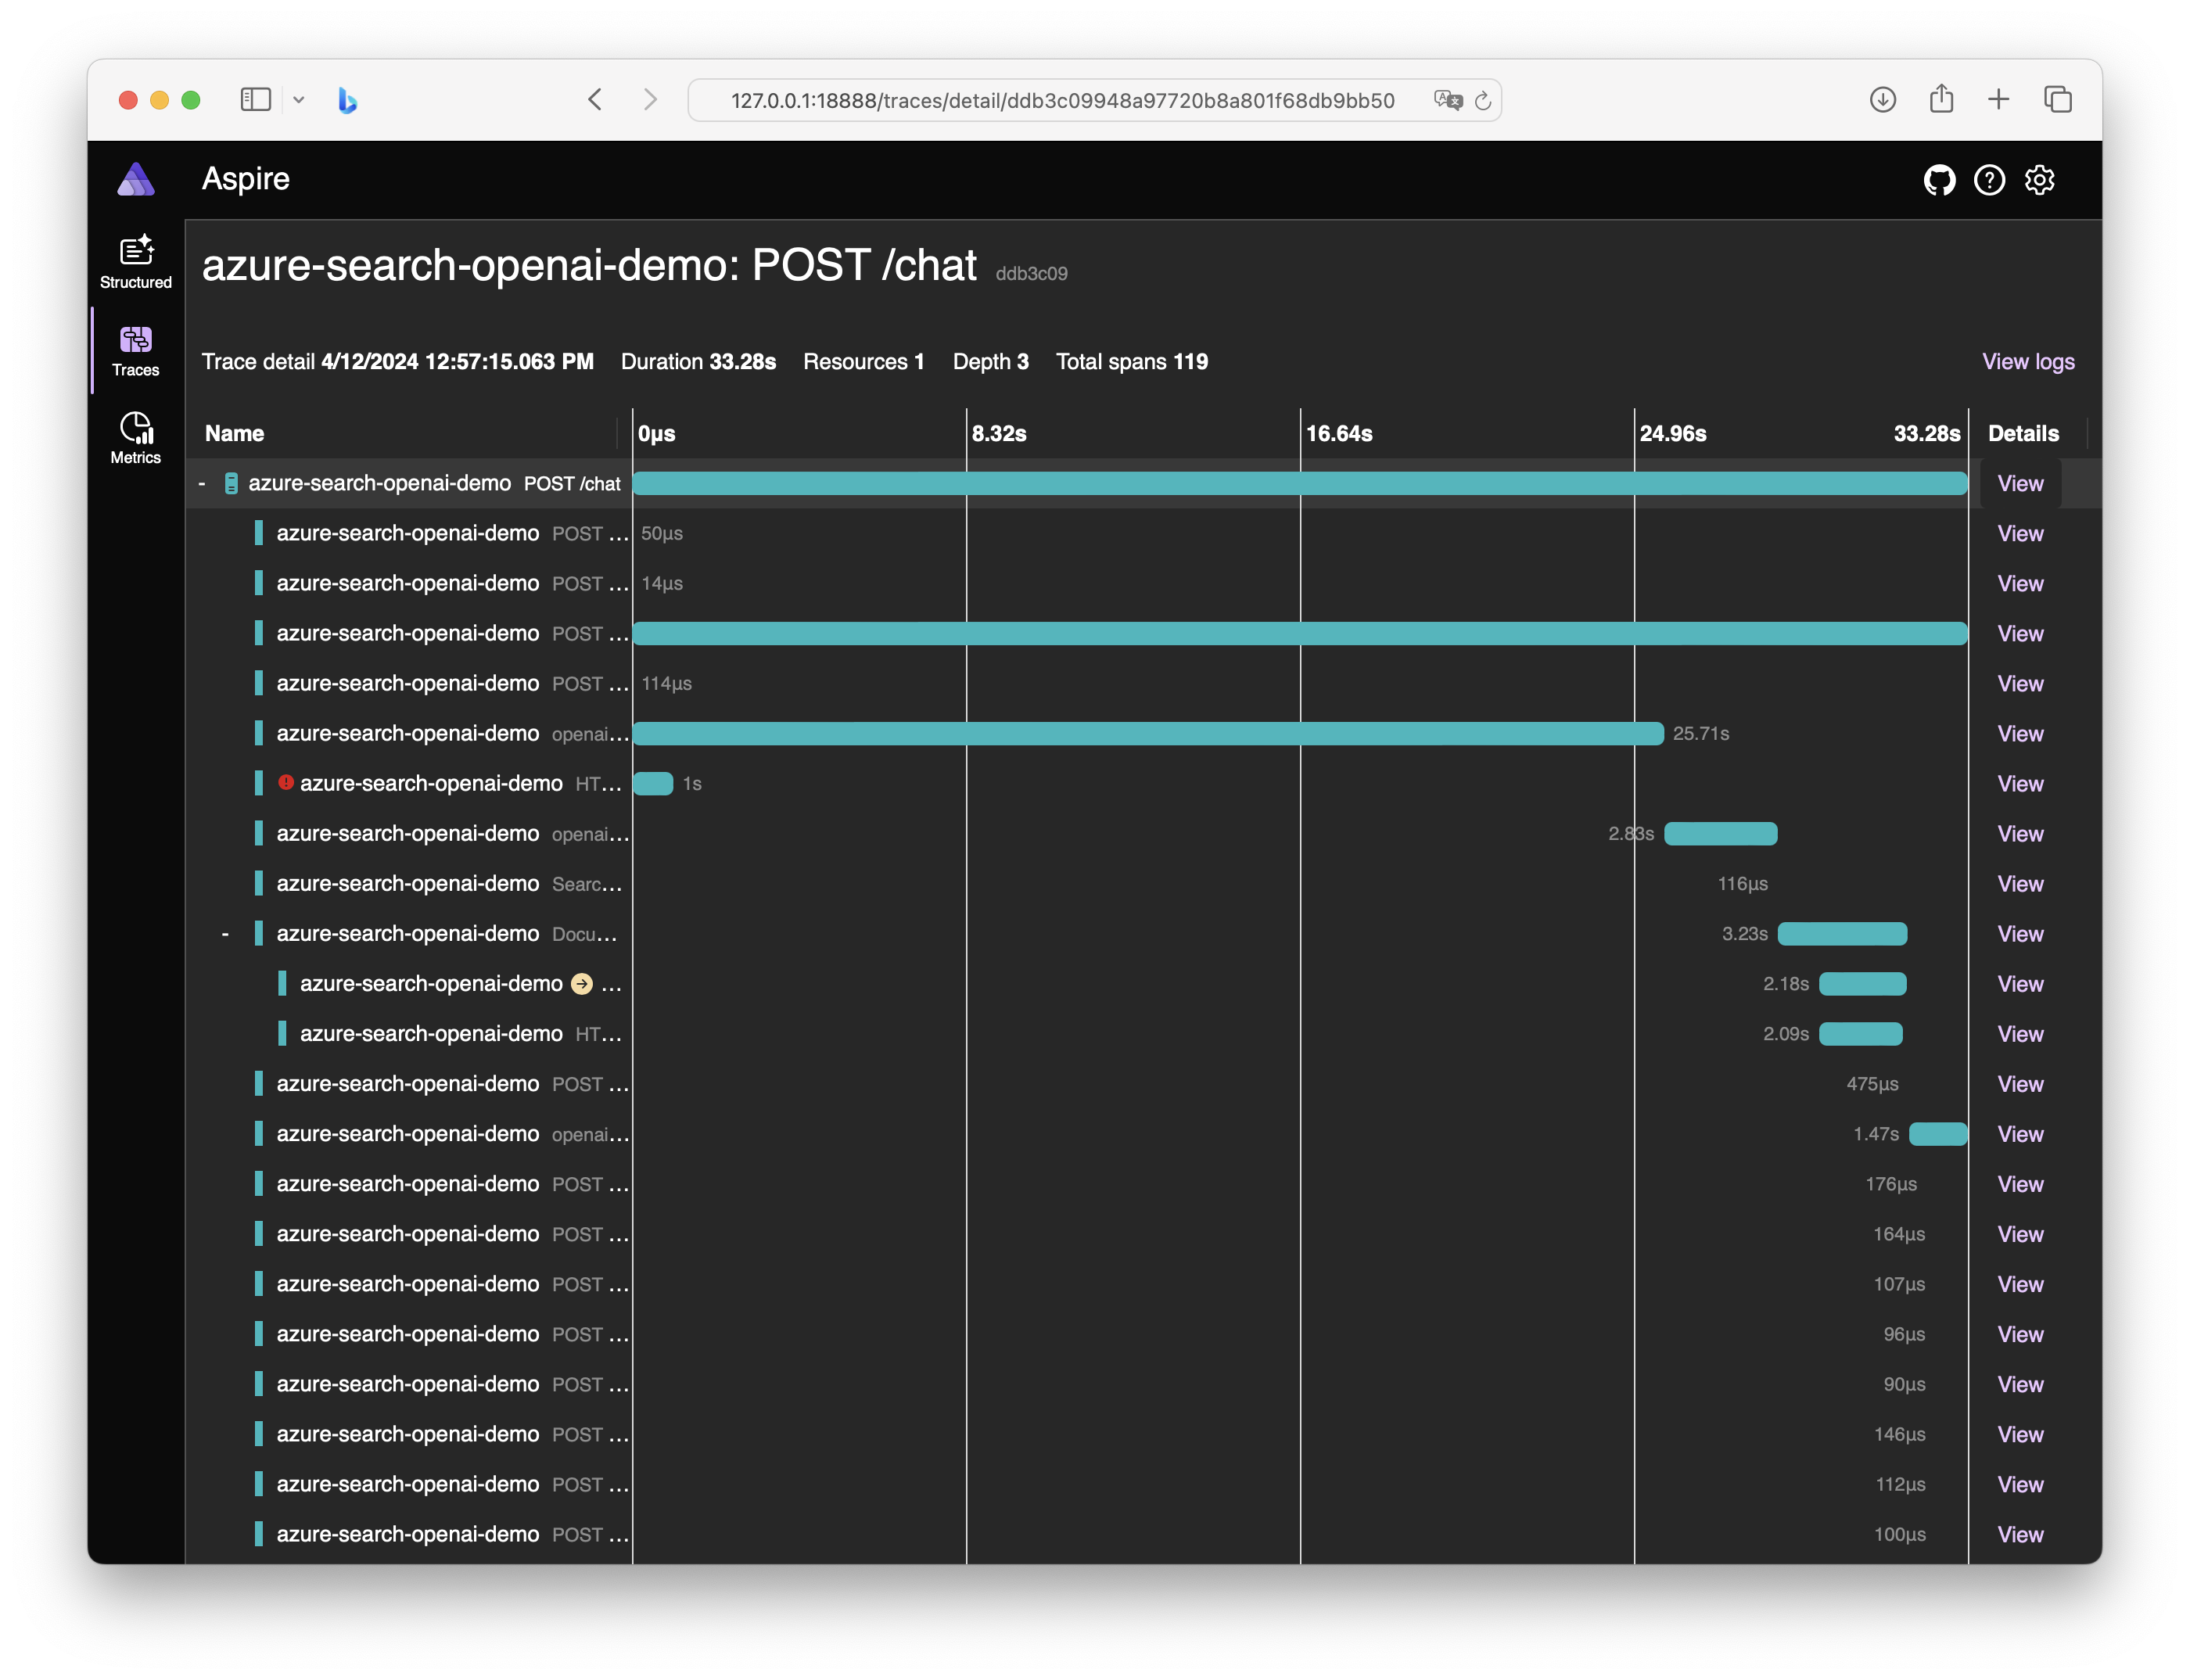
In a trace, the default view is a timeline. For any item in that trace, you can expand it to see additional properties. These properties depend on the instrumentation package. You can add instrumentation for things like SQL queries, HTTP requests, gRPC calls and more. The OpenTelemetry Python project has a lot of instrumentation packages available, so you can add more detail to your traces. Here’s the detail on a trace to OpenAI:
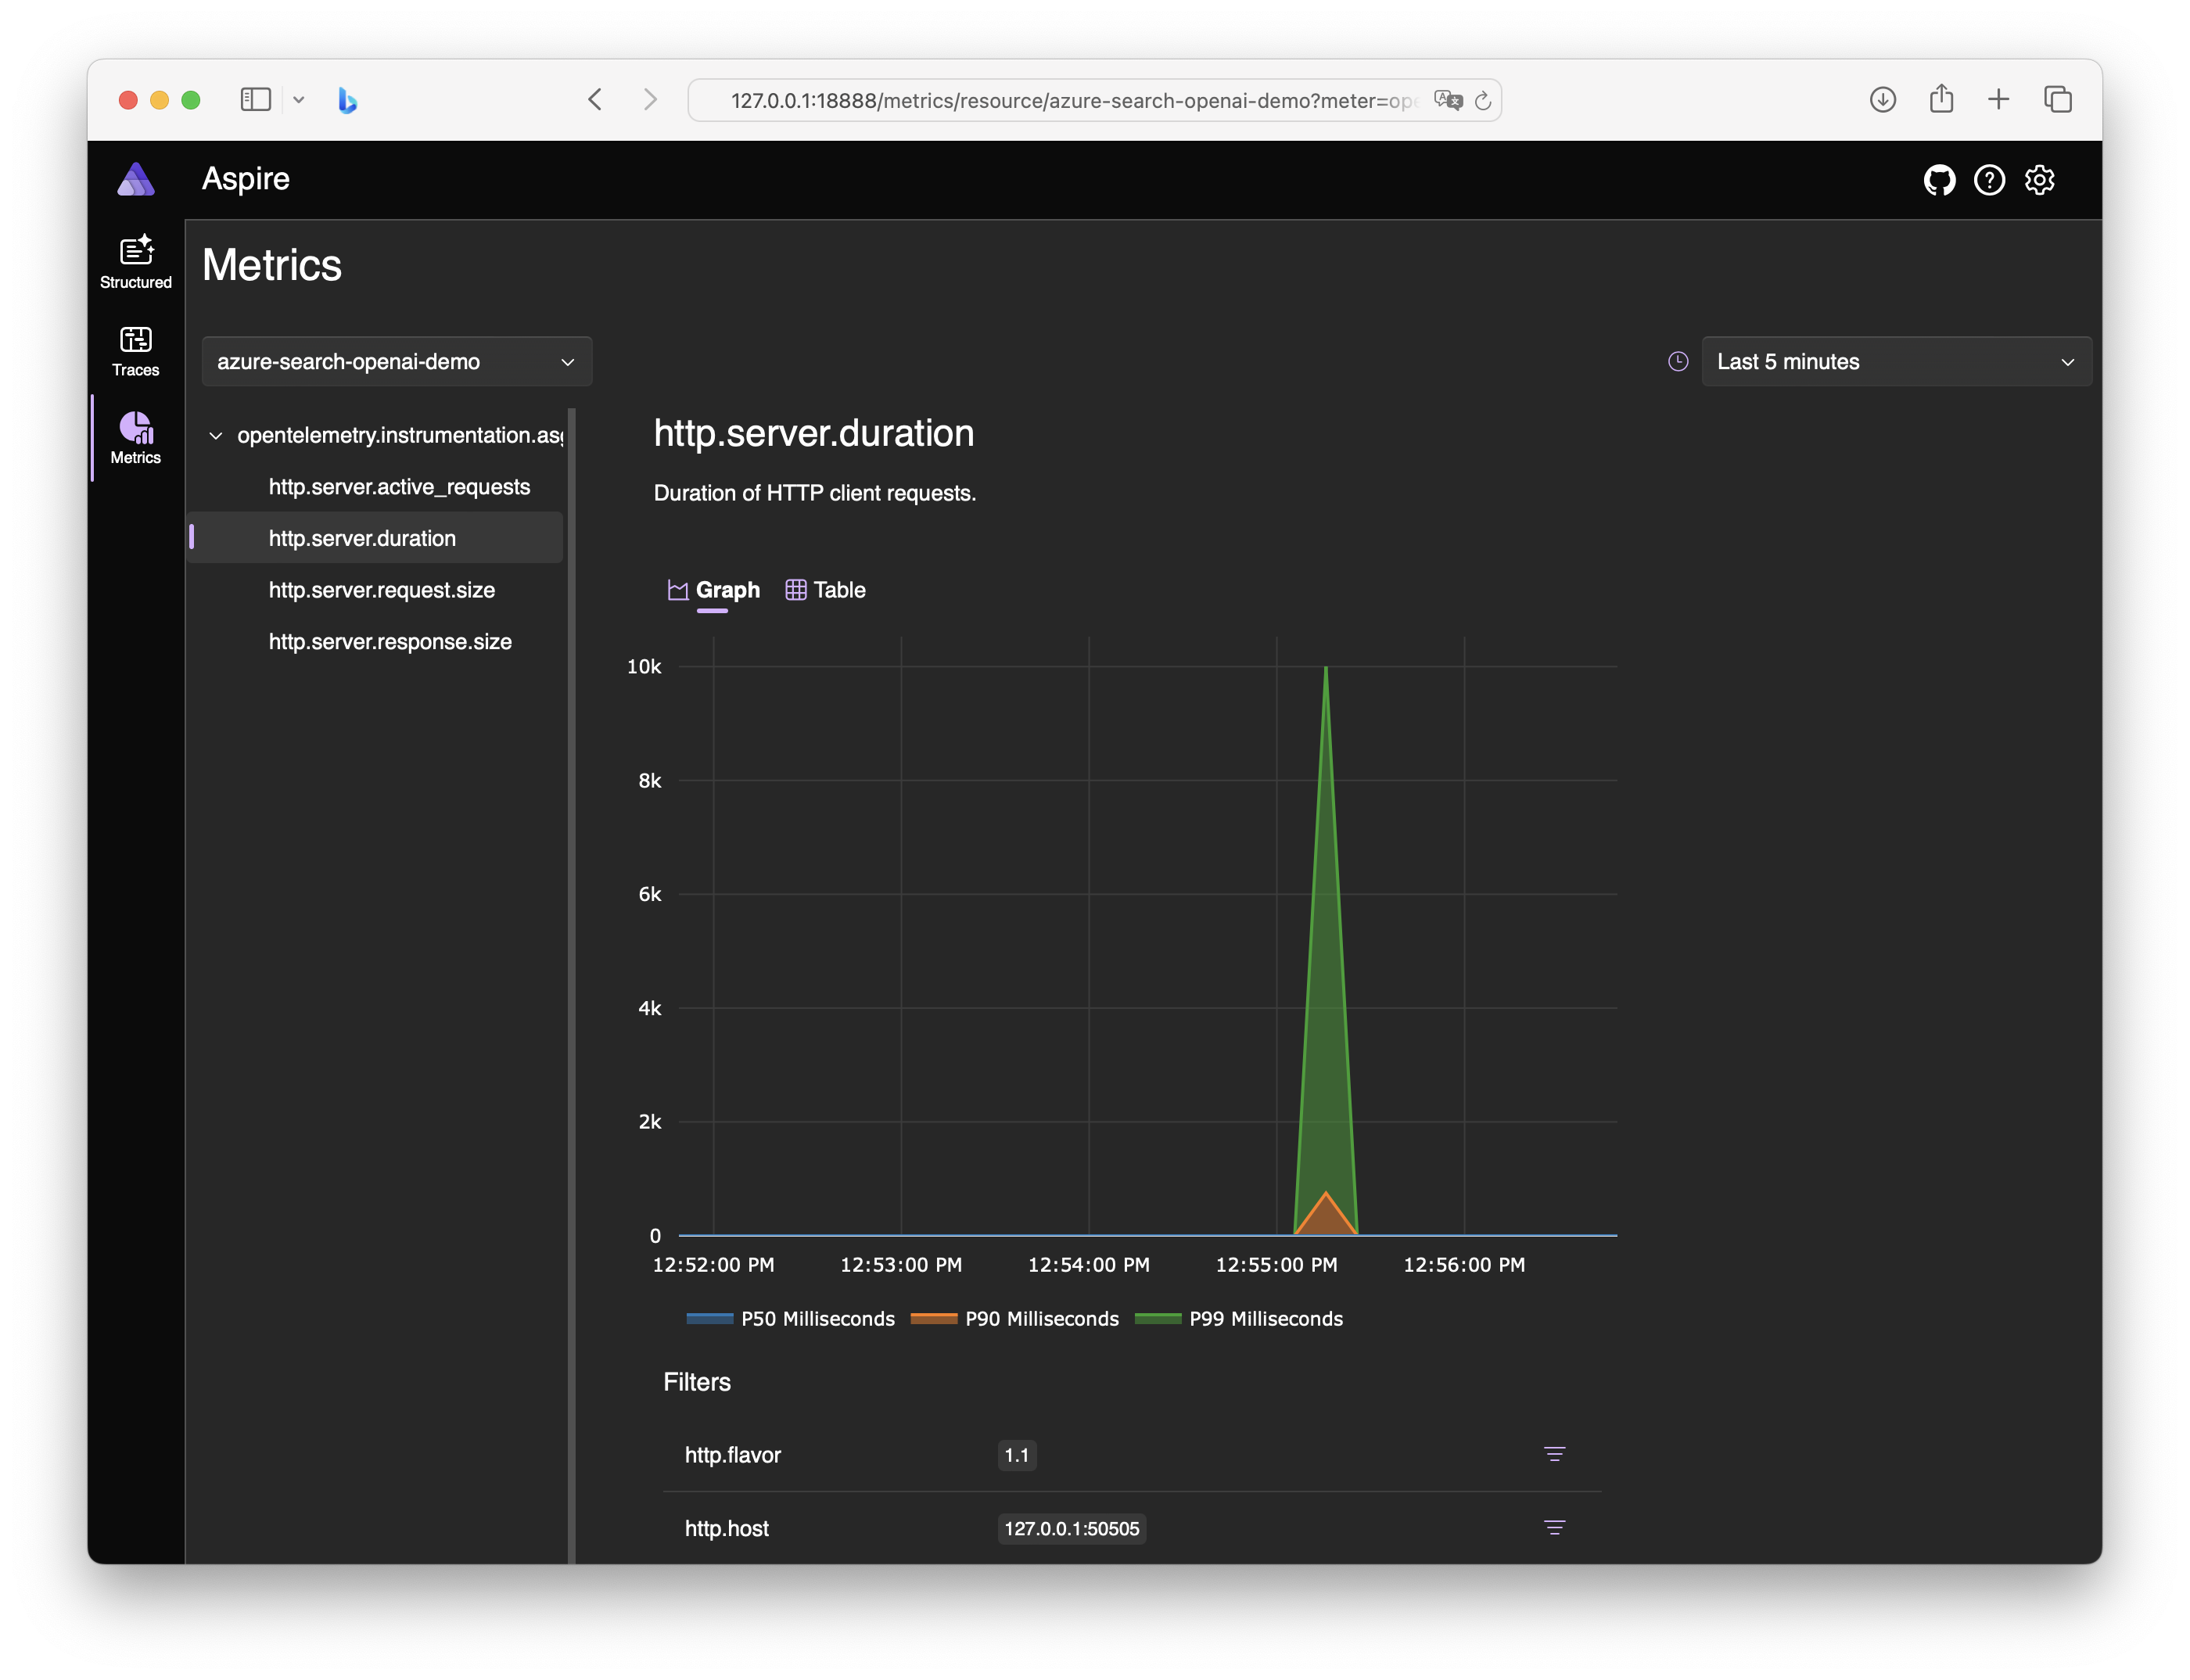
The third tab is Metrics. This will show you the metrics that are captured by OpenTelemetry. In the sample project, I’ve added a few custom metrics to show how they appear in the dashboard. You can see the count of requests, the duration of requests and the status codes of requests. You can also see the breakdown of the metrics over time.
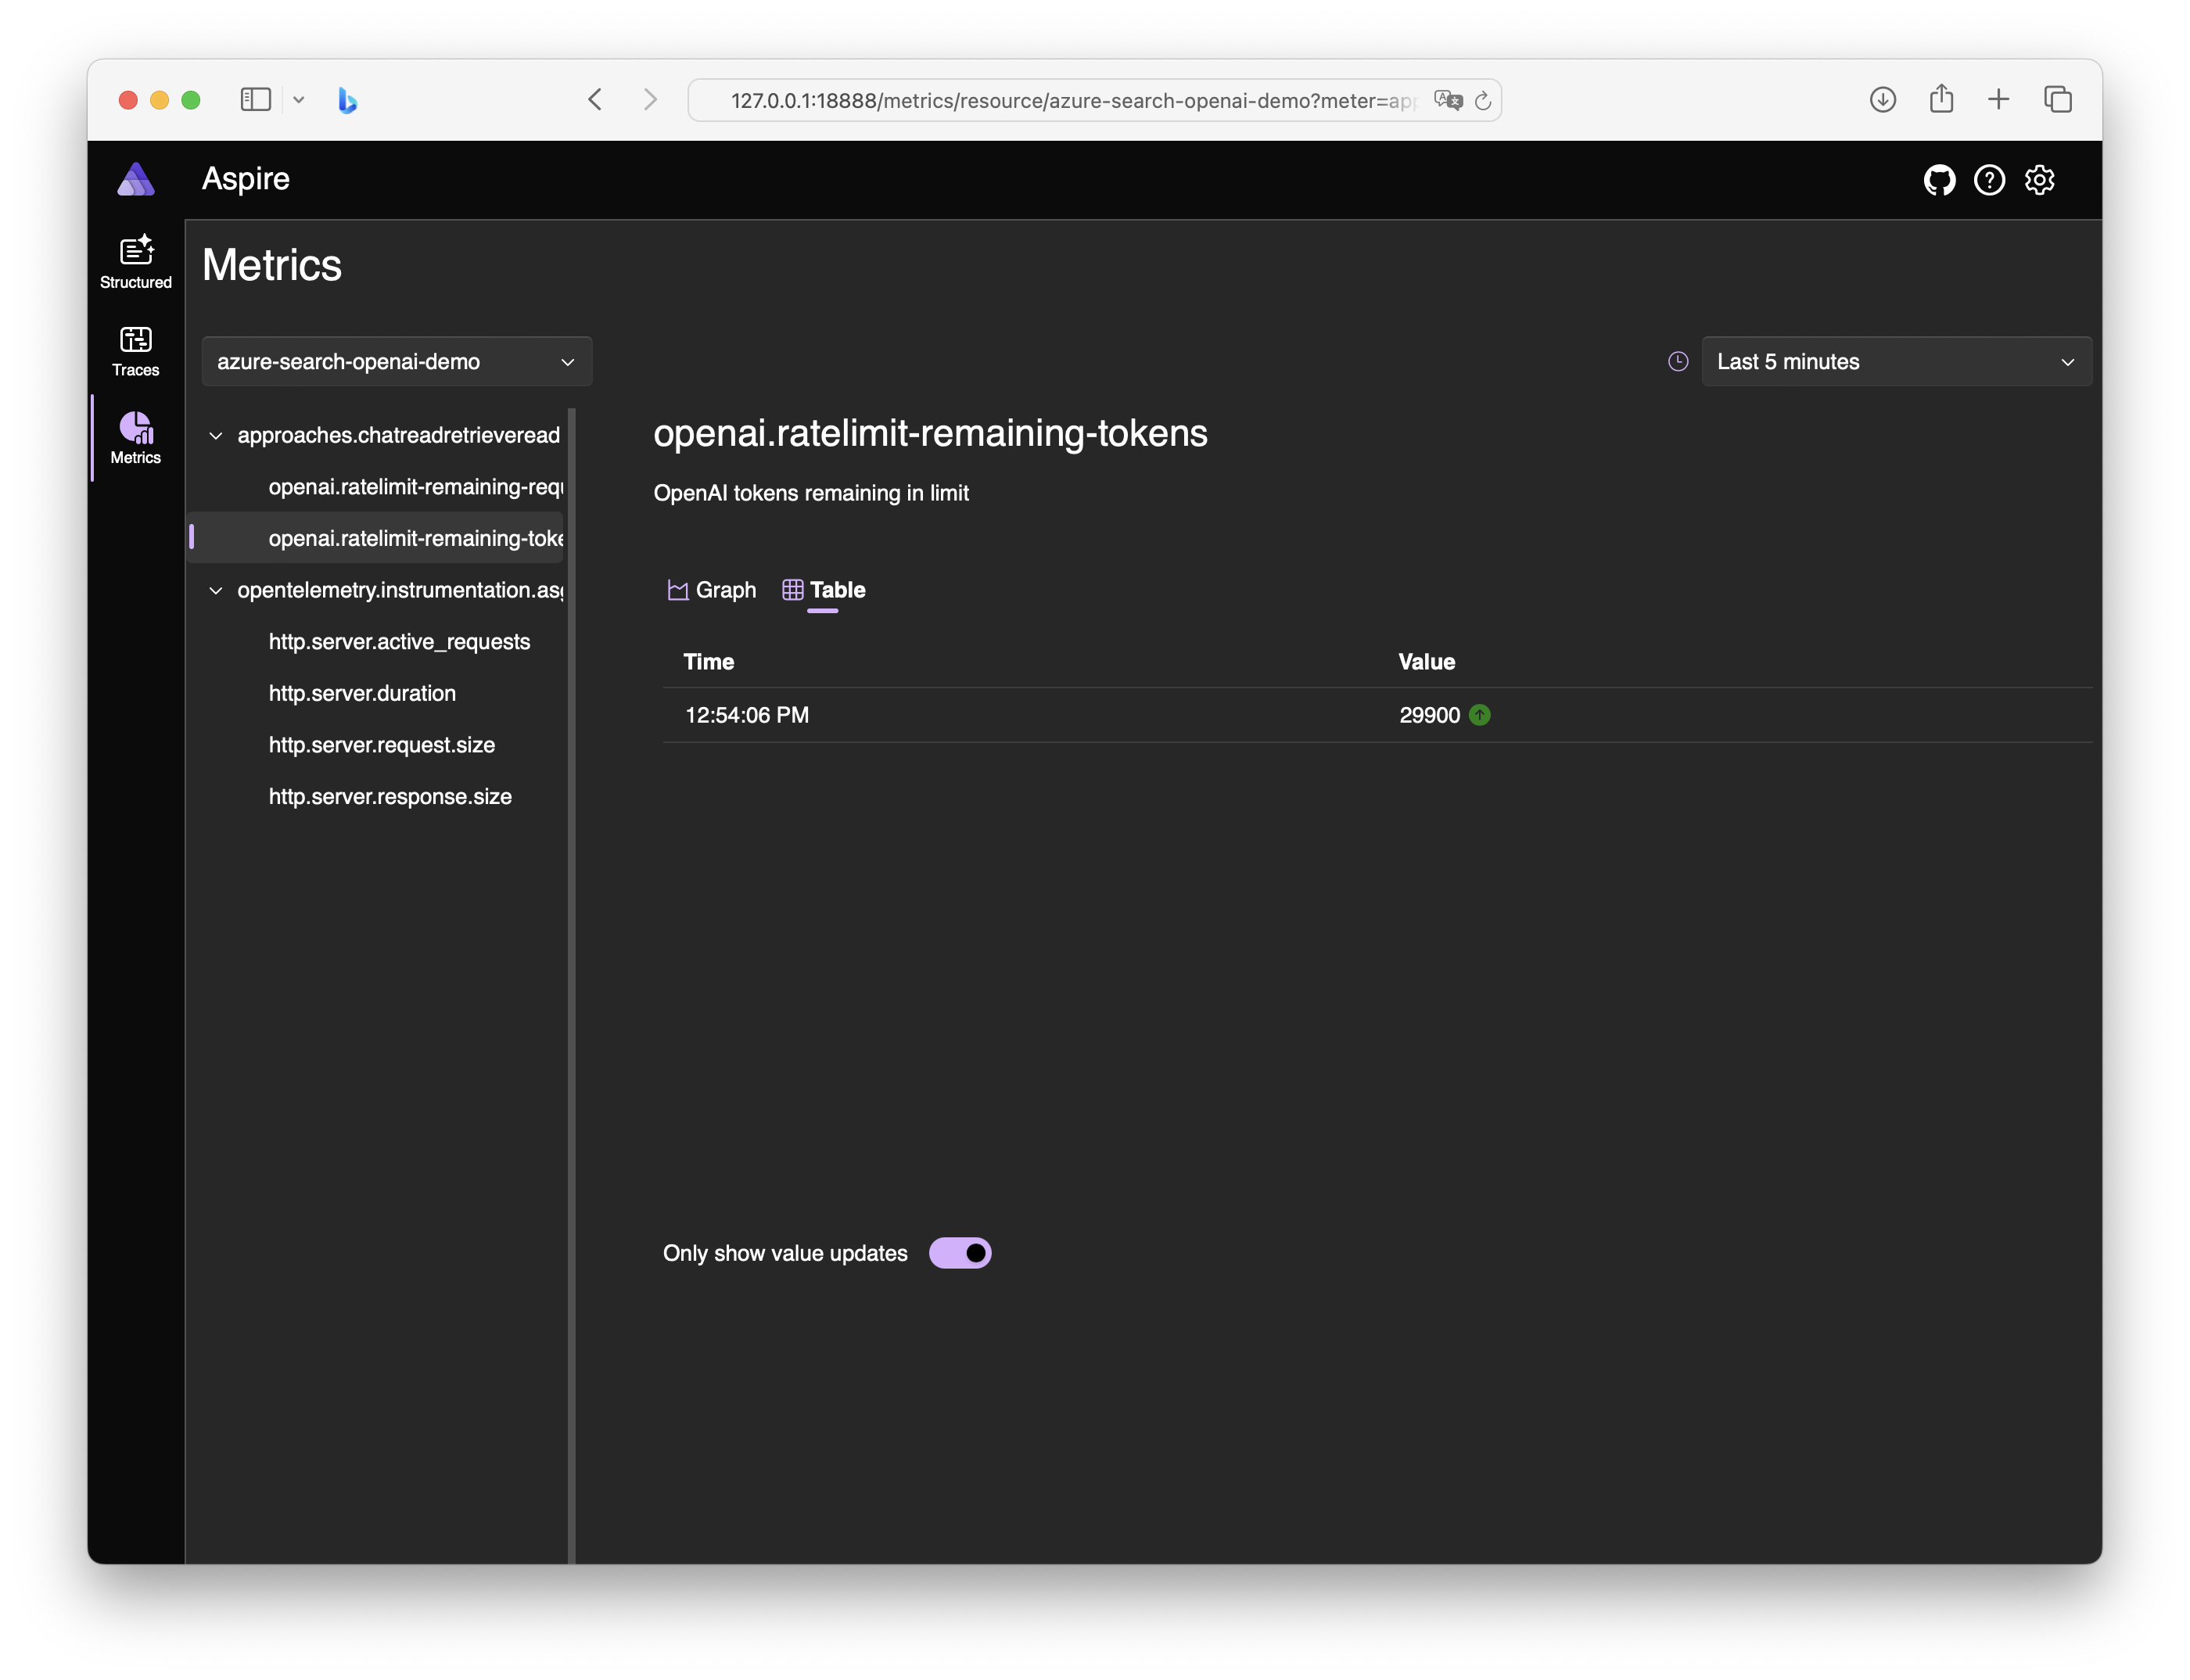
Gunicorn instrumentation comes with some basic metrics, but you can add custom metrics to your Flask app to capture more detailed information. I added a custom metric from the OpenAI API to capture the number of remaining tokens in the rate-limit. This one is best viewed in table mode:
Once you’re done exploring or debugging, stop the Docker container and the dashboard will be gone. You can start it again with the same command and it will be a fresh instance.
Conclusion
When you’re developing an application with a lot of backend calls or trying to debug performance issues, OpenTelemetry is a great tool to have in your toolbox. It’s easy to get started with and has a lot of instrumentation packages available. The Aspire dashboard is a great way to visualize the data that OpenTelemetry captures and it’s easy to run locally. I hope this tutorial has been helpful, and you can get started with OpenTelemetry and the Aspire dashboard in your Python applications.

Extra credits
Thanks Anthony Simmon for this great article on the Aspire dashboard and OpenTelemetry to get me started.
Related Posts