There are hundreds of benchmarks out there for LLMs. Most are focused on quality, capability, and accuracy. The LLM Perf leaderboard is great if you’re hosting the model yourself, but doesn’t take into account the realities of latency talking to hosted models in the cloud.
The actual throughput you get on a model like Llama or Gemma is going to depend entirely on where it’s running. Sometimes you want to pick a language model that is “small” and fast. This is where performance benchmarking comes in.
Why Benchmark LLMs?
When picking a language model, I think you generally need to select the fastest and cheapest model for the task you have. This is especially true for agents. Looking at a demo for a platform like Agentic RAG on langgraph’s website:
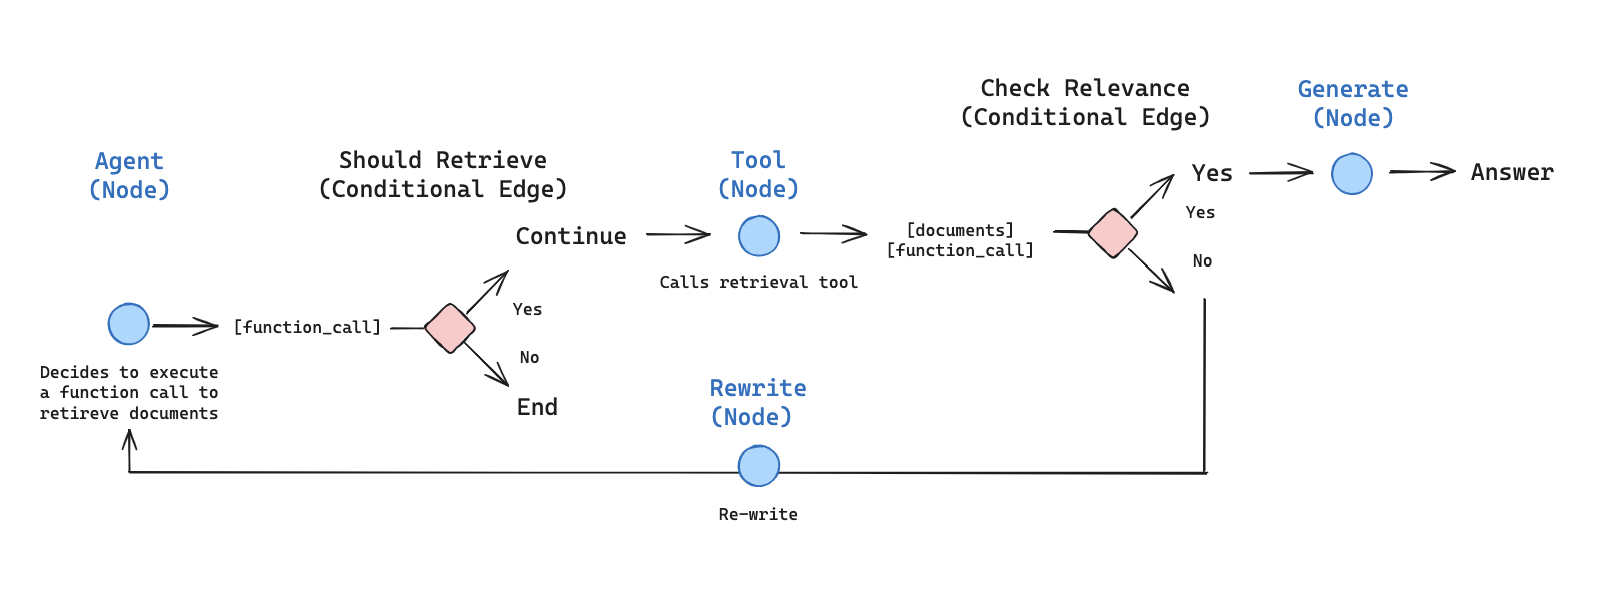
They’ve selected OpenAI’s GPT-4.1 for this tutorial, but unpacking the workflow there are three prompts:
- A yes/no grading prompt which marks retrieved documents as to their relevance
- A rewrite prompt which extracts the semantic intent from the question so that retrieval is more effective
- A final answer prompt which generates the answer based on the retrieved documents
You could use an advanced evaluator to compare how well each model performs on these prompts. At-a-glance I think GPT-4.1-mini could handle the first and second prompts. This would give you a 5 times cost reduction. The choice of GPT-4.1, GPT-5, or one of the mini models for the answer depends on how long you want the answer and the quality expectations.
What I do want to see is whether this agent flow will run any faster by switching from GPT-4.1 to GPT-4.1-mini. I can run a benchmark using a little plugin to the llm CLI I wrote last week to get the answer:
$ llm benchmark -m azure/gpt-4.1 -m azure/gpt-4.1-mini --repeat 10 "Look at the input and try to reason about the underlying semantic intent / meaning.\n Here is the initial question:\n ------- \nWhat does Lilian Weng say about types of reward hacking?\n ------- \nFormulate an improved question:" --graph mini-full-compare.png
That will print out this comparison table:

At-a-glance it doesn’t look like GPT-4.1-mini would actually be faster because its average time to respond is worse than GPT-4.1. This is odd, but there’s more to unpack- let’s look at what we’re benchmarking and what impacts the results.
Quick Comparisons
To get started, you’ll need the profile plugin for the llm CLI. To install the plugin and llm:
$ pip install llm-profile
or to install it into your existing LLM environment:
$ llm install llm-profile
This adds a benchmark command to llm. The LLM Profiling tool is an extension to LLM because LLM already comes with plugins to connect to OpenAI.com, OpenRouter, Anthropic, Google, and just about any other major AI provider. You can also connect it to locally hosted models on something like ollama.
There are two ways of running the benchmark command, either giving all the arguments over the command line or by writing out a more detailed test plan.
For the command-line option, you need to provide a list of models to test against and a prompt. Running llm models lists all available models. In the example I gave above, I have LLM connected to my Azure AI Foundry account using the Azure AI Foundry plugin. As I mentioned before, you could be using anything, like the built-in OpenAI.com hosted models, or Anthropic.
To run the benchmark, you list as many models as you like with the -m argument, then the prompt. By default, it will only run the prompt once. To get a more accurate measure provide the --repeat option:
$ llm benchmark -m gpt-4.1 -m gpt-4.1-mini -m o4-mini "What is the capital of Azerbaijan?" --repeat 10
Unpacking the results
In my first demo benchmark, the results table showed that GPT-4.1-mini was on average slower than GPT-4.1 which surprised me.
In the example above, I used the --graph argument to specify the path to a PNG containing box plots for the 4 metrics. That looks something like this:
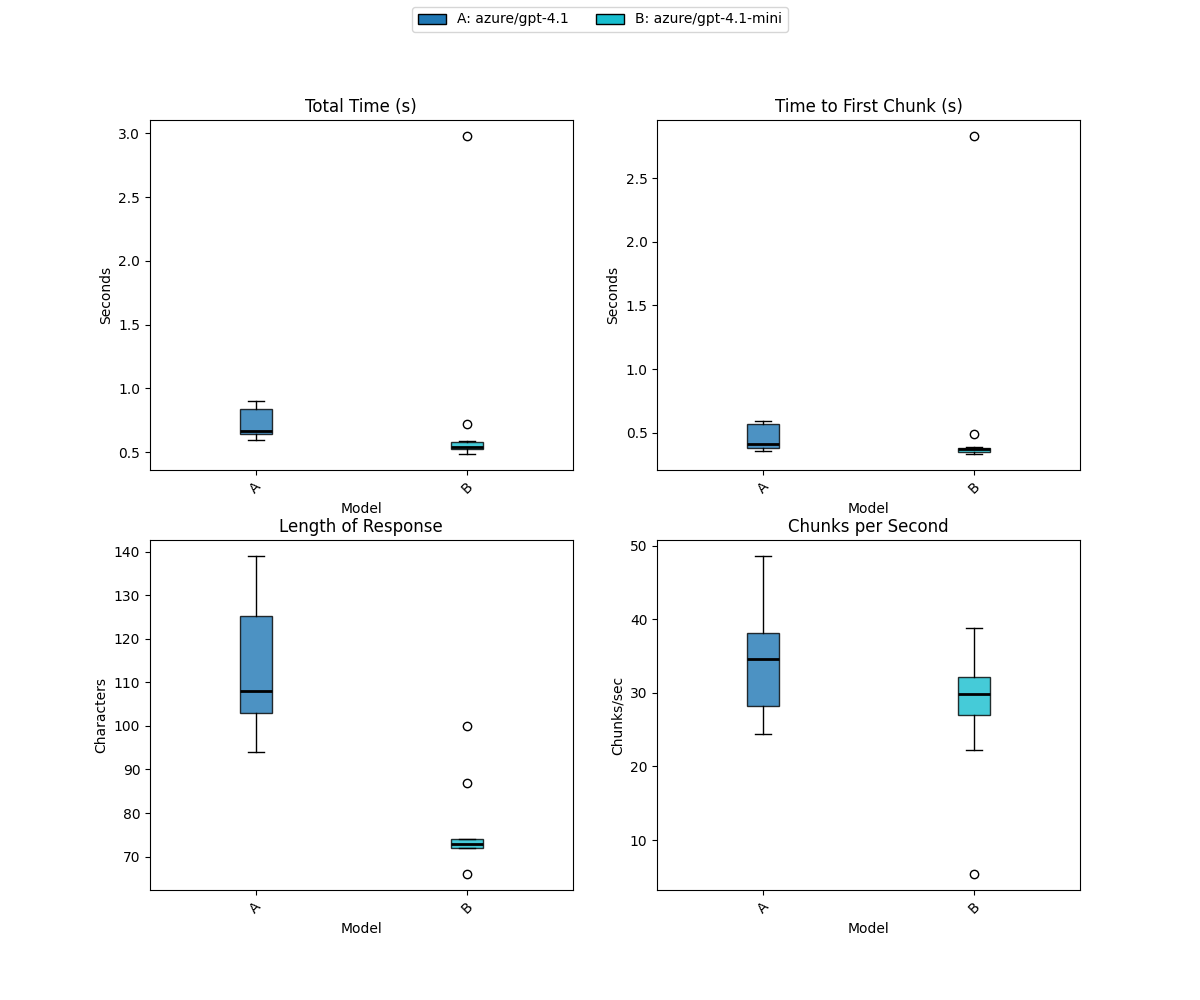
If you’re not familiar with boxplots, they’re a way to represent a distribution of data points through their quartiles. Average is a terrible metric for performance testing because one outlier can skew the data and outliers occur in network systems all the time. A boxplot shows the spread and skewness of the data, making it easier to identify trends and anomalies.
- The colored box represents the interquartile range (IQR), which contains the middle 50% of the data points.
- The thick black line inside the box is the median (the 50th percentile).
- The “whiskers” extend to the minimum and maximum values within 1.5 * IQR from the quartiles.
- Points outside of this range are considered outliers and are plotted individually as circles.
Or, to put it more simply, the colored box is the range of times you get most of the time. The larger the box, the wider the range is.
Looking at our original benchmark, although GPT-4.1-mini had an average (mean) of 0.8 secs v.s. 0.73 for GPT-4.1, that was because of a 3 second outlier. The median value is closer to 0.6, the IQR is far smaller and lower in the timing range. Or, to put it simply, most of the time it’s twice as fast, but one time it was really slow. Generally speaking, in network testing we look at the 95th to 99th percentile to get a better sense of the typical user experience. The 3 second outlier is probably unrelated to the AI and a consequence of the person digging up the road outside my house (but such is the reality of the Internet).
For that test, I used the US-East 2 location, which is one of the more popular locations. It’s also about 10,000 miles from my computer. Which isn’t ideal.
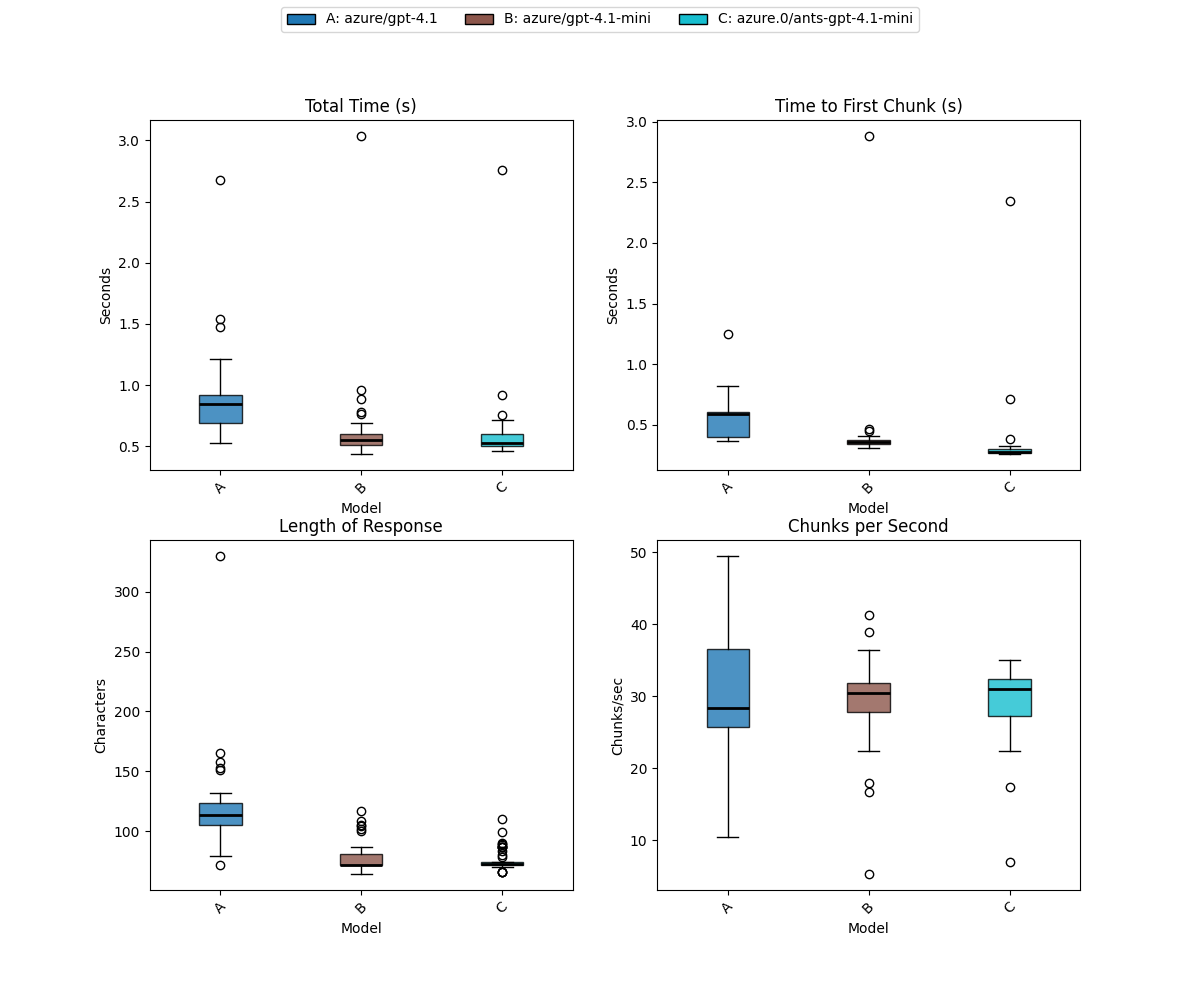
The Azure AI Foundry plugin for LLM supports multiple AI Foundry projects and I have one in Australia East (100 miles away) to test on. To get a better spread of data, I’ve changed it to run each model prompt 100 times:
Tip: Use the
--markdownflag to output the results table in a Markdown friendly format
| Benchmark | Total Time | Time to First Chunk | Length of Response | Number of Chunks | Chunks per Second |
|---|---|---|---|---|---|
| azure/gpt-4.1 | 0.53 <-> 2.67 (x̄=0.88) | 0.37 <-> 1.25 (x̄=0.56) | 72 <-> 330 (x̄=118.3) | 15 <-> 60 (x̄=25.0) | 10.47 <-> 49.51 (x̄=30.22) |
| azure/gpt-4.1-mini | 0.44 <-> 3.04 (x̄=0.62) | 0.31 <-> 2.88 (x̄=0.41) | 64 <-> 117 (x̄=77.8) | 15 <-> 24 (x̄=16.8) | 5.27 <-> 41.24 (x̄=29.43) |
| azure.0/ants-gpt-4.1-mini | 0.46 <-> 2.76 (x̄=0.60) | 0.26 <-> 2.35 (x̄=0.33) | 66 <-> 110 (x̄=76.0) | 15 <-> 24 (x̄=16.6) | 6.88 <-> 35.10 (x̄=29.53) |
Chunks and Response Length determine time to respond
Responses from LLMs are token streams. Since you need to transfer this data over a network, tokens are split into chunks and these chunks are streamed back to you in several HTTP responses. A well-designed integration with an LLM will stream the responses back to the user instead of waiting for the entire response. This is why GPT UIs like ChatGPT seem to be ‘typing’ back to you. It’s streaming the data back as it comes in.
For benchmarking, this is important because we care about three things:
- How long does it take for the first chunk to arrive (time to first chunk)
- How many chunks are there?
- How long does it take for all of them to arrive?
The number of chunks is determined by the length of the answer. Each chunk contains several tokens (depending on how it’s setup). If you ask for a short essay, there could be hundreds of chunks, if you ask the LLM for a one word answer there could be 1.
The LLM profiler presents these metrics:
- Total Time (Sec)
- Time to First Chunk (Sec)
- Length of Response (Characters)
- Number of Chunks
- Chunks per Second
Chunks per second = number of chunks ÷ total time; it’s our throughput metric.
This is very important to understand for the comparison between GPT-4.1 and GPT-4.1-mini because the default responses for GPT-4.1-mini will be shorter than GPT-4.1, therefore it has fewer chunks. You can see that in the table, on average GPT-4.1-mini has a 77 character answer compared to 118 for GPT-4.1.
Going to the right-hand plots the Time to First Chunk and Chunks per Second, GPT-4.1-mini is consistently faster (both in US-EAST2 and Australia East) to start streaming data back. Australia East is the fastest, because it’s the closest to me (the chunks have to travel down the tubes to my house). Then for chunks per second, they all perform similarly but the IQR is wider for GPT-4.1.
Another curiosity is that GPT‑4.1’s length range went up to 330 characters. This is important to keep in mind because, for the same prompt with the default temperature and no random seed, response length can vary significantly between calls.
In Conclusion
- Shorter answers have shorter response times. Nowhere in the original prompt did we specify our expectations for response length; it was determined by the model’s weights.
- GPT-4.1-mini is faster to start streaming data back than GPT-4.1
Detailed Plans
We’re starting to tap into the performance characteristics of these models in more detail. Let’s test out a theory that we can get better performance by giving the LLM constraints about the expected response length. Max Output Tokens is a crude option that I rarely use. It “cuts off” responses that are too long, but it doesn’t help with shorter responses.
Instead, let’s refactor that original prompt:
Look at the input and try to reason about the underlying semantic intent / meaning.
Here is the initial question:
-------
What does Lilian Weng say about types of reward hacking?
-------
Formulate an improved question:
Let’s try another version of that prompt that gives more clarity to what “improved” means:
Analyze the given input to understand its underlying semantic intent. Here is the initial question:
-------
What does Lilian Weng say about types of reward hacking?
-------
Formulate an improved question that is clearer and more specific:
The LLM benchmark plugin has a second mode where you provide a test plan in the form of a YAML file. In the test plan YAML, we provide a name, the repeat count and then an optional dictionary of model options (temperature, seed, etc.). You can also put an options section in each model definition, say for example you wanted to compare reasoning effort between model runs.
Then provide a list of models by a name, model id (from llm models) and the prompt. You can also set things like system for system prompt.
Let’s put that together and compare our original prompt with an “improved” one against both GPT-4.1-mini in Australia East and GPT-5-chat in US East 2:
name: Comparing Prompts
repeat: 50
options:
  temperature: 0
models:
  - name: GPT-5-chat (Original)
    model: azure/gpt-5-chat
    prompt: |
        Look at the input and try to reason about the underlying semantic intent / meaning.
        Here is the initial question:
        -------
        What does Lilian Weng say about types of reward hacking?
        -------
        Formulate an improved question:
  - name: GPT-5-chat (Improved)
    model: azure/gpt-5-chat
    prompt: |
        Analyze the given input to understand its underlying semantic intent. Here is the initial question:
        -------
        What does Lilian Weng say about types of reward hacking?
        -------
        Formulate an improved question that is clearer and more specific:

  - name: GPT-4.1-mini (Original)
    model: azure/gpt-5-chat
    prompt: |
        Look at the input and try to reason about the underlying semantic intent / meaning.
        Here is the initial question:
        -------
        What does Lilian Weng say about types of reward hacking?
        -------
        Formulate an improved question:
  - name: GPT-4.1-mini (Improved)
    model: azure/gpt-5-chat
    prompt: |
        Analyze the given input to understand its underlying semantic intent. Here is the initial question:
        -------
        What does Lilian Weng say about types of reward hacking?
        -------
        Formulate an improved question that is clearer and more specific:
Then to run we provide the --plan argument with a path to the YAML file and request a graph.
$ llm benchmark --plan test-plan-gpt-5.yaml --graph gpt-5-4-compare.png --markdown
| Benchmark | Total Time | Time to First Chunk | Length of Response | Number of Chunks | Chunks per Second |
|---|---|---|---|---|---|
| GPT-5-chat (Original) | 0.61 <-> 1.75 (x̄=0.71) | 0.33 <-> 0.49 (x̄=0.36) | 172 <-> 184 (x̄=172.2) | 39 <-> 39 (x̄=39.0) | 22.23 <-> 63.92 (x̄=56.52) |
| GPT-5-chat (Improved) | 0.66 <-> 2.13 (x̄=0.99) | 0.32 <-> 1.00 (x̄=0.38) | 191 <-> 488 (x̄=321.1) | 43 <-> 99 (x̄=69.2) | 32.76 <-> 87.36 (x̄=70.60) |
| GPT-4.1-mini (Original) | 0.47 <-> 3.01 (x̄=0.64) | 0.26 <-> 2.74 (x̄=0.34) | 74 <-> 100 (x̄=93.6) | 16 <-> 19 (x̄=18.4) | 6.31 <-> 40.10 (x̄=31.49) |
| GPT-4.1-mini (Improved) | 0.49 <-> 1.20 (x̄=0.60) | 0.25 <-> 0.39 (x̄=0.28) | 86 <-> 110 (x̄=88.5) | 19 <-> 24 (x̄=19.5) | 15.86 <-> 39.05 (x̄=33.32) |
The results are interesting:
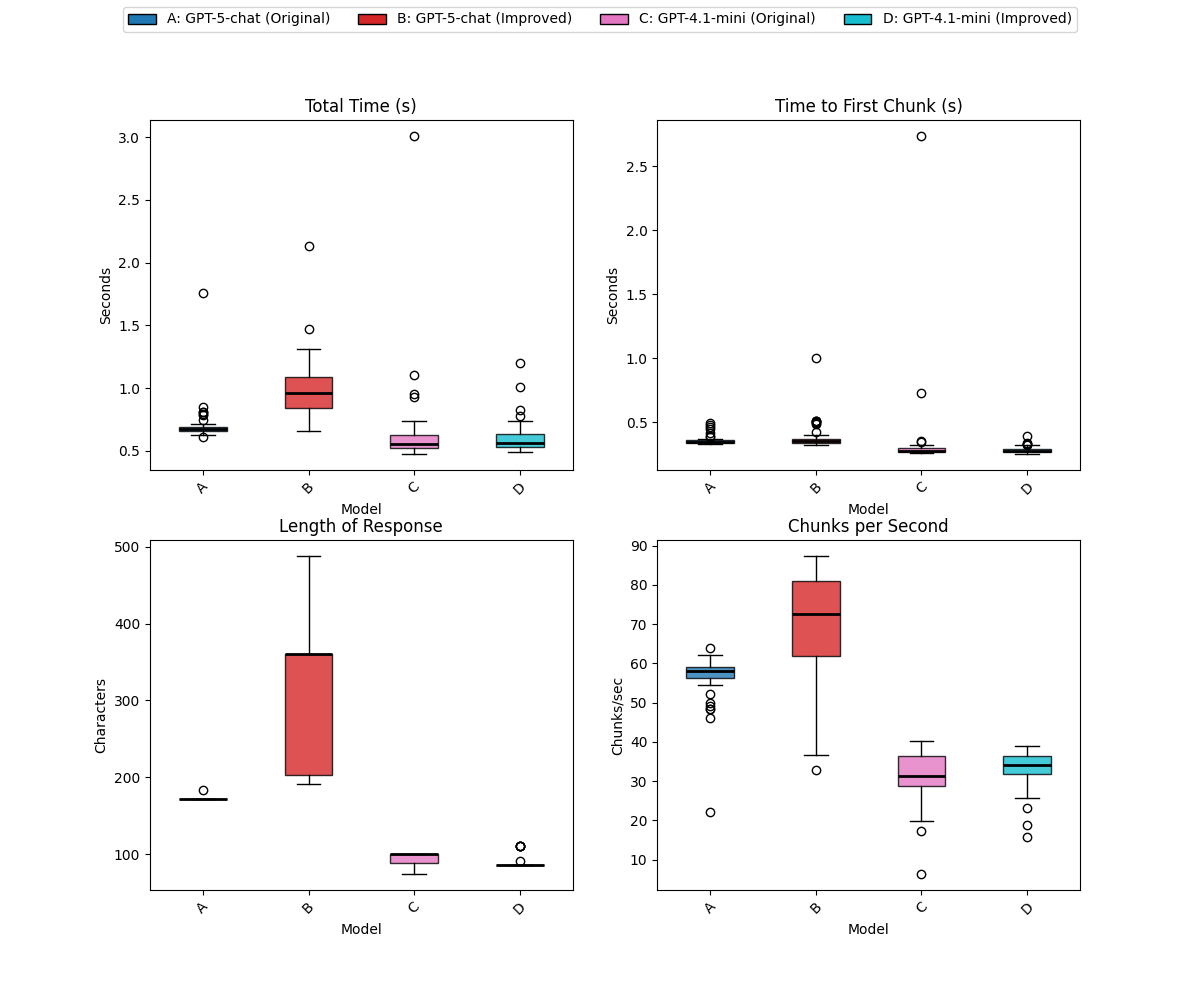
Reading this chart:
- The “improved” prompt actually made the responses significantly longer in GPT-5-chat, but consistently shorter in GPT-4.1-mini!
- The “improved” prompt gave a larger IQR for GPT-5-chat for length, time and throughput (I don’t understand this one).
In summary, this demonstrated the value in doing profiling of the different models. We could have tested one (GPT-4.1-mini) and seen the shorter answers then upgraded to GPT-5-chat and assumed it would perform better.
Now, we’re missing a point here that shorter is not necessarily better. For this Agentic Retrieval task, we need to consider the quality and relevance of the responses, not just their length. Sometimes we want short answers from LLMs, sometimes we want particularly relevant ones. That’s the purpose of eval libraries. Sometimes the larger models can waffle on for ages before getting to the point, which costs time and money.
Benchmarking Embedding Models
So far we’ve looked at language models. The LLM CLI also supports embedding models. Embedding models are used a lot in semantic search and RAG. They have different characteristics than LLMS. For a given input the result is deterministic. It’s also the same length (dimensions) so all we want to measure is how long it takes to respond. The embedding model benchmark you want to checkout for how well it performs at retrieval is the MTEB (Multilingual Text Embedding Benchmark).
After looking at that, you’ll likely settle on the same 3 models that everyone else uses. So let’s look at those.
In LLM, you get a list of embedding models with this command:
$ llm embed-models
For the LLM profiler, there’s another command, llm embed-benchmark with similar syntax to provide an input (text), then one or many models to compare.
The --graph, --repeat and --markdown flags all apply as well.
Let’s compare a few models, OpenAI text-embedding-small with both dimension configurations, the old ada-002 model and for fun, I’ll test nomic-embed running on my laptop using ollama:
$ llm embed-benchmark "I'm on the red eye flight to nowhere. How about you?" -m azure/text-embedding-3-small-512 -m azure/text-embedding-3-small -m azure/text-embedding-ada-002 -m nomic-embed-text:latest --repeat 50 --markdown
| Benchmark | Total Time |
|---|---|
| azure/text-embedding-3-small-512 | 0.45 <-> 10.48 (x̄=1.13) |
| azure/text-embedding-3-small | 0.88 <-> 9.55 (x̄=1.35) |
| azure/text-embedding-ada-002 | 0.87 <-> 3.40 (x̄=0.99) |
| nomic-embed-text:latest | 0.67 <-> 3.03 (x̄=1.06) |
All of the Azure OpenAI models I tested were deployed in US East (10,000 miles away), so the timing is mostly network latency.
We get a single graph:
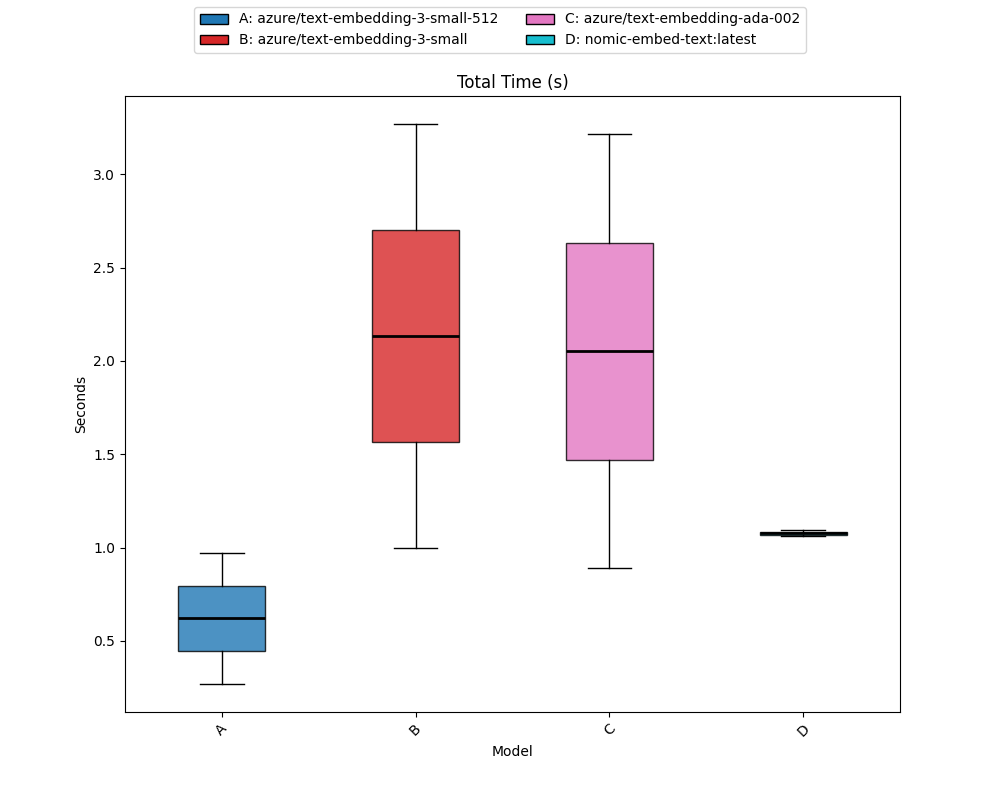
Amazingly, nomic on my NPU ran very well. So much so I’ve used it to generate the “Recommended Posts” at the end of all my blogs.
Conclusion
It’s always important to test all aspects of a system thoroughly. Using LLM and this plugin you can measure latency and throughput of different models in different locations and on different platforms. It also helps identify prompts and configurations to see how they impact the length of the stream coming back from the model.
For simple scenarios, look for the fastest and cheapest model for what you need to do.
Related Posts